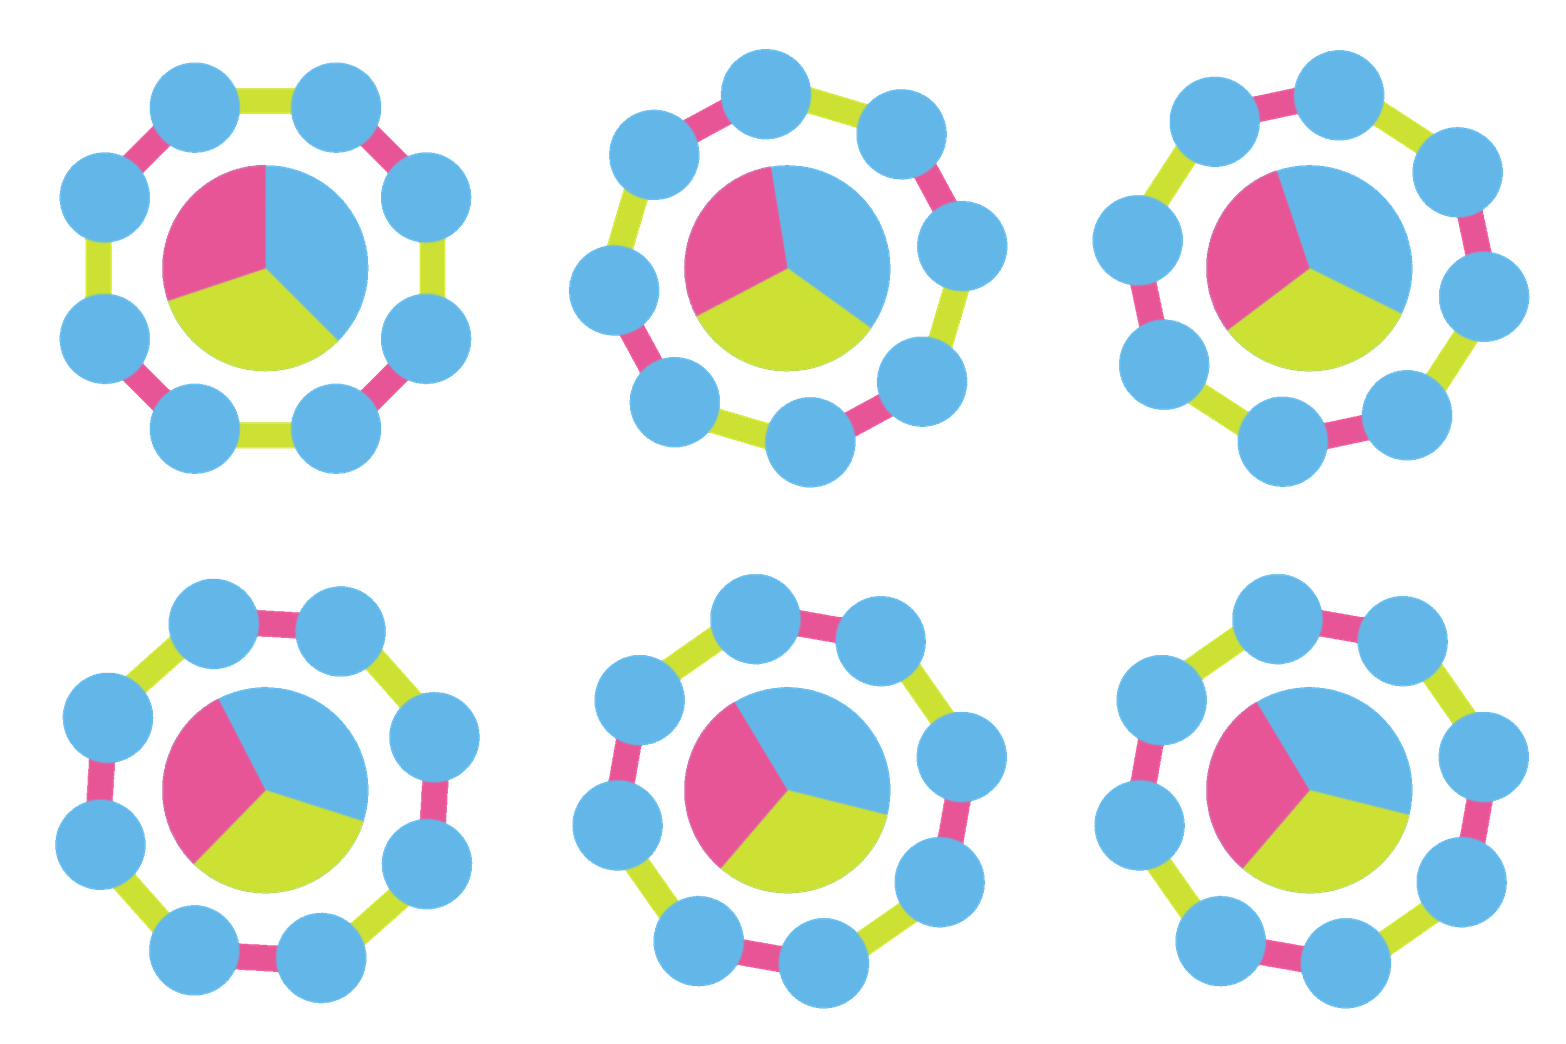
At 4Strokes Digital, we follow a structured and collaborative process to ensure the highest quality cluster graphics for your data visualization needs. Here’s how we work:
We begin with a detailed consultation to understand your data objectives, dataset characteristics, and specific requirements for the cluster graphics. This helps us tailor our services to meet your unique analytical needs.
Our team thoroughly analyzes your data, identifying key patterns, clusters, and relationships that need visualizing.
Based on the data analysis, we develop a concept for the cluster graphics, outlining the visual representation and interactive features that will best communicate your insights.
Using advanced software and visualization techniques, we design custom cluster graphics that effectively illustrate the identified clusters and data patterns.
We incorporate interactive elements such as hover-over details, clickable filters, and dynamic animations to enhance user engagement and exploration of the data.
We present the initial cluster graphics to you for feedback and review. Your input is crucial in refining the visuals to accurately represent your data insights.
Based on your feedback, we make necessary revisions to the cluster graphics to ensure they meet your expectations and effectively communicate your data findings.
Once approved, we deliver the final cluster graphics in your preferred formats, ready to be integrated into reports, presentations, dashboards, or any other platform.


4Strokes Digital transformed our online presence and significantly boosted our ROI. Their expertise in digital marketing is unmatched, and their strategic approach has been a game-changer for our business.

Working with 4Strokes Digital has been a fantastic experience. Their team is incredibly knowledgeable, responsive, and dedicated to our success. We've seen remarkable growth since we started partnering with them.

The results speak for themselves. 4Strokes Digital's innovative strategies and deep understanding of digital marketing have delivered outstanding results for our brand. Highly recommend their services!
From the initial consultation to ongoing support, 4Strokes Digital has exceeded our expectations. Their tailored solutions and attention to detail have been instrumental in our digital marketing success.
Choosing 4Strokes Digital for your cluster graphic services means partnering with a team dedicated to excellence, innovation, and client satisfaction. Here’s why we stand out:
Our team comprises skilled data analysts and visualization experts with extensive experience interpreting and visualizing complex datasets.
We blend analytical rigor with creative flair to produce cluster graphics that inform, engage, and inspire action.
We tailor our cluster graphic services to meet your data visualization needs, ensuring the visuals align with your objectives and enhance decision-making.
We uphold the highest quality standards in every project, using industry best practices and techniques to deliver precise and impactful cluster graphics.
We value collaboration and communication throughout the process, ensuring your data insights are effectively translated into visual form.
With efficient workflows and fast turnaround times, we ensure timely delivery of your cluster graphics, empowering you to make informed decisions swiftly.
Your satisfaction is our priority. We offer continuous support and revisions to ensure you are delighted with the final cluster graphics and their impact on your data analysis.


We can visualize various types of data, including customer segmentation, market trends, scientific research findings, financial data patterns, and more.
The timeline for cluster graphic creation depends on the complexity and scope of the data. We aim for efficient delivery while maintaining high quality, typically completing projects within a few weeks.
Absolutely! We encourage you to share your data objectives, specific insights you want to highlight, and any preferences for visualization styles. Your input helps us create cluster graphics that align perfectly with your analytical needs.
Yes, we specialize in creating interactive cluster graphics that allow users to explore data clusters, drill down into details, and gain deeper insights through dynamic visualizations.
We deliver the final cluster graphics in various formats, including PNG, JPEG, PDF, and interactive formats suitable for web-based platforms and presentations.
1942 Broadway Street STE 314C
Boulder, CO, United States
All rights reserved –
4Strokes Digital